Air masses affecting the British Isles
The British Isles have variable Weather describes the day-to-day condition of the atmosphere. It might be sunny, hot, windy or cloudy, raining or snowing. that changes from day to day, between different regions and within different regions.
Consequently, it is very difficult to predict or forecast the weather.
The variability of weather and Climate means the average weather conditions in a particular location based on the average weather experienced there over 30 years or more. in different regions is due to the different air masses over the Isles.
An air mass is a large body of air with uniform temperature and moisture characteristics and is usually thousands of kilometres wide.
The This is a measure of the amount of heat in the atmosphere. and moisture characteristics will depend on its point of origin and the journey it then takes over land or sea.
It will remain over a place for a period of time and will then start to move.
Each air mass brings with it these different characteristics, as shown in the map below.
Four of the main air masses that affect the British Isles are:
Tropical maritime (warm and moist air)
- Air moves from the warm south Atlantic Ocean towards the south west of the British Isles.
- Mild conditions in the winter but wet weather in the summer.
- Brings clouds, drizzle and fog.
Tropical continental (warm and dry air)
- Typically happens in the summer.
- Warm, dry air from North Africa and the Mediterranean bring warm, dry weather.
- Will bring mild conditions in the winter.
Polar maritime (cold and moist air)
- The most common air mass, starting in the North Atlantic ocean.
- Brings unstable air that creates clouds.
- Can cause rainfall in the summer.
Polar continental (cold and dry)
- Occurs more in the winter than the summer.
- Starts over north Europe and brings cold conditions in the winter but milder conditions in the summer.
- Can bring unstable air in the winter (producing snow) but usually just brings cool, dry conditions.
Frontal depressions across the British Isles
An area of low pressure is called a In meteorological terms, a depression is an area of low air pressure..
It is low pressure because air is rising from the surface and as it rises, the air will cool and condense forming clouds and rainfall.
Depressions therefore bring unsettled weather and rain.
Winds are normally stronger too because as air rises, cold air rushes in to replace the air at the surface. The faster the air rises, the stronger the winds.
These low-pressure systems form over the Atlantic Ocean and are carried across Britain by westerly winds. They are responsible for the UK's changeable weather.
Depression formation
In the Atlantic Ocean, the cold This is the most common air mass, starting in the North Atlantic ocean. Brings unstable air that creates cumulus and cumulonimbus clouds. Can cause convectional rainfall in the summer. and warm Air moves from the warm south Atlantic ocean and moves over the south west of the British Isles. It brings mild conditions in the winter but wet weather in the summer. It causes nimbostratus clouds, drizzle and fog.An air mass is a large body of air (usually thousands of kilometres wide) which will remain over a place for a period of time and will pick up the key temperature and moisture characteristics of that area. It will then start to move. will meet.
Where they meet is called the Polar Front.
The lighter warm air will start to rise up over the denser, colder air and this creates an unstable area that will develop a front.
Sequence of a depression
The diagram shows a depression with a leading These are formed when warm air rises over a mass of cold air. As the air lifts into regions of lower pressure, it expands, cools and condenses the water vapour as wide, flat sheets of cloud. and a trailing These are usually associated with depressions. A cold front is the transition zone where a cold air mass is replacing the warmer air mass. The cold air is following the warm air and gradually moves underneath the warmer air. moving from west to east across Britain.
At the warm front, lighter, warmer air from the South (tropical maritime air) meets cooler air from the North (polar maritime air) and rises gradually over it.
As the warm air slowly rises it cools, its water content condenses and clouds form (cirrus, altostratus and then nimbostratus). The result is steady rain, later giving way to drizzle and finally clearer skies.
Behind the warm front is an area of warm, rising air and low pressure (the An area of warm air between the warm front and the cold front in a depression.) - the centre of the low-pressure system. As this part of the depression passes over, there may be a short period of clear, dry weather. There may also be some drizzle. However, at the trailing cold front, heavier, cooler air meets the warm air at the centre of the depression, undercutting it and forcing it steeply upwards. Quickly moving air masses produce high winds and cooler temperatures.
As the rapidly rising warm air cools, its water condenses and clouds form (cumulonimbus, then cumulus). The result is heavy rain or thunderstorms, giving way to showers and finally to clear skies as the cold front moves away eastwards.
Key characteristics of Fronts and the Warm Sector as they pass overhead
| Stage | Cold front | Warm sector | Warm front |
|---|---|---|---|
| Pressure | Pressure starts to rise | Pressure is steady | Pressure falling |
| Temperature | Temperatures falling | Warmest temperature | Temperatures increasing |
| Precipitation | Heavy rainfall, for a short time | Dry, perhaps drizzle | Steady rain for a long period |
| Wind Speed | Strong winds | Gentle breeze | Fresh winds |
| Wind Direction | North West | West | South West |
| Cloud Type | Cumulonimbus | Cumulus | Cirrus, followed by Stratus |
| Air Mass | Polar Maritime undercuts Tropical Maritime | Tropical Maritime | Tropical Maritime rises over Polar Maritime |
Key features of a depression
Pressure – Low and falling (below 1000 This is the measurement of atmospheric pressure. The average (or normal) pressure is 1000 mb and when the pressure goes above this it is classed as high pressure. When the pressure goes below this, it is classes as low pressure.) towards the centre. - These are shown by the isobars on the weather map. Isobars are lines joining places of equal pressure.
Temperature – Varies depending on the air mass passing overhead (and the time of year). Tm air brings warmer temperatures. Pm air brings cooler temperatures.
Cloud cover – An ever-changing selection of clouds will change as the depression passes. The maximum amount of cloud will be when the cold front passes overhead.
Wind speed and direction – Strong winds will usually blow in an anticlockwise direction around the depression. The depression weather system will usually move in a NE direction across the British Isles.
Precipitation – There are variable amounts of rainfall as a depression passes. A depression usually takes about 5 days to pass and this can bring a wide variety of rain, sleet and snow during that time. Precipitation normally happens at the fronts.
Anticyclones in the British Isles
A high-pressure system is called an An area of high atmospheric pressure where the air is sinking and no clouds are formed. Anticyclones can occur in both winter and summer with varying effects..
Air sinks in an anticyclone so no clouds are formed. This is because as the cold air sinks towards the Earth’s surface, it is warmed. Warm air expands and can hold more moisture than cold air. This means that condensation cannot happen and therefore neither cloud or rain can form.
In all anticyclones, cold air in the upper atmosphere sinks and warms as it nears the Earth.
This means that the air will expand and can hold more moisture. Therefore, the air will not be saturated and this means clouds cannot form.
In Summer, a lack of clouds means the sun can shine directly onto the Earth’s surface and because the British Isles is closer to the Sun in the summer, this direct sunlight with long days can bring higher temperatures, gentle breezes and sometimes heatwaves.
In Winter, when days are shorter and the British Isles is further from the Sun, the lack of cloud will mean bright days, but cold temperatures by day and very cold temperatures at night because any heat built up over the short hours of daylight, will escape back to space, which can lead to frost or fog forming.
Key features of a summer anticyclone
Pressure – High and increasing (over 1000 This is the measurement of atmospheric pressure. The average (or normal) pressure is 1000 mb and when the pressure goes above this it is classed as high pressure. When the pressure goes below this, it is classes as low pressure.)
Temperature – Very warm air will be brought over from continental Europe. This can bring hot, sunny days and ‘heatwave’ conditions.
Cloud cover – Sinking air means that air is settled and clouds will not be formed. Temperatures at night will drop as heat will escape back into the atmosphere because there are no clouds to prevent it.
Wind speed and direction – are spaced apart, there is very little wind and conditions will be calm due to a gentle pressure gradient. Any wind will rotate in a clockwise direction around the weather system.
Precipitation – No precipitation but there can be mist in the morning, though this is usually burned off by the sun very quickly. Dew is found on grass in the morning due to overnight condensation.
Key features of a winter anticyclone
Pressure – High and increasing (over 1000 mb)
Temperature – Temperatures are much lower. The sun is low in the sky so there is less heating in the air.
Cloud cover – Sinking air means that air is settled and clouds will not be formed. Temperatures at night will drop very quickly as heat will escape back into the atmosphere. This can cause freezing conditions – frost, fog and ice.
Wind speed and direction – Isobars are not close together, there is very little wind and conditions will be calm. Any wind will rotate in a clockwise direction.
Precipitation – No rain will fall as there are no clouds but there can be mist early in the morning and sometimes a temperature inversion near ground level will cause heavy fog. Frost would be unlikely as the air at the ground level will be warmer than overlying air.
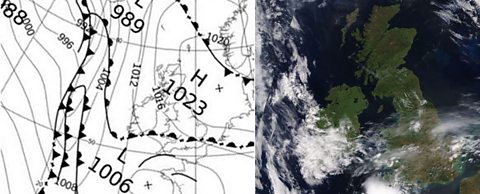
Synoptic charts
To get a complete picture of the weather around the world, weather observations are taken at agreed times at weather stations worldwide. There are 10000 land based weather stations around the world and they collect data every three hours every day. This information is fed into a supercomputer.
They are then plotted onto a synoptic chart.
A synoptic chart is a weather map that uses isobars to show pressure and summarises with symbols the atmospheric conditions (This is a measure of the amount of heat in the atmosphere., This is the amount of moisture or water that is in the atmosphere and can be water vapour, rain, sleet, fog, snow or ice., wind speed and direction, Atmospheric pressure is the weight of air pressing down on us. Air is light but because there is so much of it above us, it exerts a pressure on us. Atmospheric pressure is measured by a barometer. The units used are millibars., cloud cover etc) over a wide area at a given time.
They display an overview of the weather conditions observed from many different land, sea and air based weather stations, including rainfall radar, buoys and satellites.
By collating the information over a wide area, meteorologists can observe the behaviour and movement of weather formations that might affect their local area in the future.
This allows People who study weather. to make more accurate weather forecasts. Charts are updated at least every six hours. However, due to the changeable nature of the weather, meteorologists cannot forecast weather reliably for more than five days in advance.
There are many different types of weather map, all drawn using internationally agreed standards and using accepted symbols.
The synoptic chart below shows complete cloud cover (eight This is the measurement for cloud cover. Each okta makes up one eight of the sky and helps us to understand how much of the sky is covered in cloud.) over most of central and southern England and some drizzle or rain.
Weather symbols can seem confusing until you look for the patterns.
Note how increasing cloud cover is shown by covering more and more eighths (oktas) of the circle.
More wind speed is shown by adding a little tail for every extra five This is the measurement of wind speed. One knot is roughly equivalent to one mile per hour. of wind (just under 5 mph/8 kmh) and a longer tail for ten knots (just under 10 mph/16 kmh).
Similarly, once you know the symbol for rain is a black circle and the symbol for snow is a star, then you know sleet will be a circle plus a star, and two, three or four circless denotes heavier rainstorms.
Isobars
Isobars are lines on a weather map joining together places of equal Atmospheric pressure is the weight of air pressing down on us. Air is light but because there is so much of it above us, it exerts a pressure on us. Atmospheric pressure is measured by a barometer. The units used are millibars..
On the map the isobar marked 1004 represents an area of high pressure, while the isobar marked 976 represents an area of low pressure.
The numbers measure the atmospheric pressure in millibars.
Usually isobars are drawn at intervals of two or four millibars.
The closer the isobars are together, the windier it is. This is due to the pressure gradient. The pressure gradient shows the difference between high and low pressure over an area. If the pressure changes rapidly over a short distance, the pressure gradient will be steep and the winds strong.
If the lowest number is in the middle circle, this is a low pressure or In meteorological terms, a depression is an area of low air pressure.. Often low pressures mean wet and windy weather.
If the highest number is in the middle circle, this is a high pressure or An area of high atmospheric pressure where the air is sinking and no clouds are formed. Anticyclones can occur in both winter and summer with varying effects.. Often high pressures mean dry, sunny weather.
Air pressure tends to range from 890 This is the measurement of atmospheric pressure. The average (or normal) pressure is 1000 mb and when the pressure goes above this it is classed as high pressure. When the pressure goes below this, it is classes as low pressure. (a hurricane) to 1060 mb (an anticyclone).
If the numbers on the isobars get lower as you move towards the centre circle, this is a clear indication of low pressure or a depression. A depression can also be identified by the L in the centre of the circle, by the closely packed isobars or most obviously by the warm and cold fronts located on the chart.
If the numbers get higher as you move towards the centre circle, then this is an area of high pressure or an anticyclone. Other ways to identify this are a letter H in the centre of the circle, widely spaced isobars and the absence of any fronts.
The weather map below shows an area of low pressure centred to the north of Scotland.
As we move away from the centre, the isobars increase in atmospheric pressure and become wider apart.
There is a zone of high pressure over Italy in the south-east corner of the map.
Note the three different kinds of front shown on the map - a These are usually associated with depressions. A cold front is the transition zone where a cold air mass is replacing the warmer air mass. The cold air is following the warm air and gradually moves underneath the warmer air., a These are formed when warm air rises over a mass of cold air. As the air lifts into regions of lower pressure, it expands, cools and condenses the water vapour as wide, flat sheets of cloud. and an .
Fronts occur where two different An air mass is a large body of air (usually thousands of kilometres wide) which will remain over a place for a period of time and will pick up the key temperature and moisture characteristics of that area. It will then start to move. meet, usually Tropical Maritime air meeting Polar Maritime air.
Weather fronts
Warm fronts
These are formed when warm Tropical maritime air rises over a mass of cold Polar maritime air.
As the air rises, it cools and contracts, which means it cannot hold as much vapour. The vapour then condenses to form clouds. At the warm front, these clouds are low altitude, layered stratus clouds.
Warm fronts are shown on A synoptic chart is any map that summarises atmospheric conditions(temperature, precipitation, wind speed and direction, atmospheric pressure and cloud coverage) over a wide area at a given time. They display an overview of the weather conditions observed from many different weather stations, aeroplanes, balloons and satellites. by a solid line with semicircles pointing towards the colder air and in the direction of movement.
On coloured weather maps, a warm front is drawn with a solid red line with red semicircles.
Cold fronts
These are usually associated with depressions.
A cold front is the transition zone where a cold Pm air mass is replacing the warmer Tm air mass.
The cold air is following the warm and gradually undercuts the warmer air.
When the warm air is pushed upwards, cooling and condensing will be rapid forming steep cumulonimbus clouds bringing heavy rain, very strong winds and possible thunder and lightning.
Often more rain will fall in the few minutes the cold front passes than it will during the whole passage of a warm front.
As the cold front passes, the clouds roll by and the air temperature is cooler.
Cold fronts are shown on synoptic charts by a solid line with triangles along the front pointing towards the warmer air and in the direction of movement.
On coloured weather maps, a cold front is drawn with a solid blue line with blue triangles.
Occluded fronts
These occur at the point where a cold front takes over a warm front or the other way around.
Occluded fronts bring changeable weather conditions.
On a synoptic chart, occluded fronts are represented by semicircles and triangles positioned next to each other.
The triangles are in blue and the semicircles are in red, or both are purple (mixing both red and blue colours together).
Satellite images
Satellite imagery are images of Earth or other planets collected by Imaging satellites operated by governments and businesses around the world. can often be used to help People who study weather. to forecast the weather over the next 12, 24 and 36 hours.
Satellites will usually show the cloud patterns over an area. Cloud patterns indicate depressions whereas a lack of cloud indicates an area of high pressure or anticyclone. For example a swirl of white cloud on an infrared satellite image often means that a In meteorological terms, a depression is an area of low air pressure. is moving in.
The Satellite image below shows an An area of high atmospheric pressure where the air is sinking and no clouds are formed. Anticyclones can occur in both winter and summer with varying effects. over the British Isles with the centre over the North Sea and impacting the North of Scotland the most.
The limitations in using satellites for forecasting
Range
The models that are used by meteorologists to predict the weather are accurate only up to 6 days. It is more difficult to measure the weather beyond this as winds can change and pressures hold steady for longer periods of time.
Accuracy
The weather forecasts struggle with accuracy - especially on a local level. There are so many climatic and local variations in weather conditions that can affect the accuracy of a forecast.
They are usually accurate for 24 hours and reasonably accurate for up to five days ahead, after which they are unreliable.
The passage of a depression across the British Isles.
[Loudspeaker Announcement]Has anyone lost an old lady in Migration Mountain? Please contact security.
[Narrator]Welcome one and all to Frontal Depressions.
As warm air rises, it presses down towards the earth’s surface.These areas of low pressure are called Depressions.
As warm air rises in a depression, it causes the formation of clouds and brings rain and wind.Depressions are formed in the Atlantic Ocean and carried over the British Isles by westerly winds.
Out over the ocean, cold, polar maritime air meets warm, tropical maritime air.Because it has expanded and is less dense, the warm air rises above the cold air.It then cools, and its water content condenses.Clouds form, and the result is steady rain.
Behind the warm front is an area of warm, rising air and low pressure.This is the centre of the low pressure system, and it creates a brief period of clear, dry weather between the warm and cold fronts.
But soon, at the trailing cold front, heavier cooler air meets the warm air and forces it sharply upwards.This brings high winds and cooler temperatures.Again, clouds form.The result is heavy rain and sometimes thunderstorms.
Eventually, the rain will lessen, giving way to clear skies once more as the cold front moves off eastward.
[Sound Effect: Slurp]
You have successfully completed Frontal Depressions.We hope to see you again soon.
Test yourself
More on Weather and climate
Find out more by working through a topic
- count4 of 4
- count1 of 4
- count2 of 4