Mathematical modelling
Mathematics is needed in all aspects of product designing, and being able to model a project on screen can help work out information before production.
Spreadsheets
Spreadsheets are a good way of organising collected data about a product. They give the user the ability to manipulate data, eg adding, sorting and numbering data, to be able to present a design to a In business, a client is a person or organisation that wants a product manufactured, eg a retailer.. Results of testing, cost of materials, opinions of A group of people who are the target market of a product and test a product before manufacturing. and product orders all offer data that can be entered into a spreadsheet to be used repeatedly in making decisions or producing evidence to support a An initial guess to a question which is then supported or rejected depending on the evidence collected..
Presentation tools
Information collated onto a spreadsheet can then be entered onto graphs or charts to provide a visual and easy to understand guide to show clients information.

Databases
A database is an organised collection of data that can be accessed by designers to collect information relevant to their designs. There are databases available to access The science of designing the product to fit the user, or the job to fit the worker. and The measurements of size and proportion of the human body. for millions of measurements, which saves a designer the time and resources of having to create their own database.
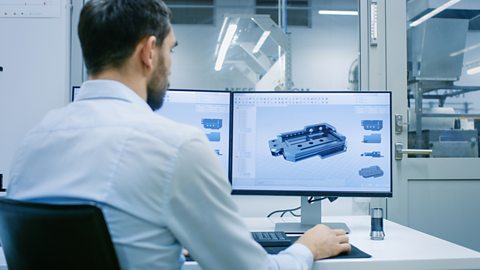
CAD modelling
When a The process of creating a 2D or 3D design using computer software. drawing has been made, a product can be shown from all angles on screen, and colour, materials and A part that when put together makes a product. can be quickly changed. This allows designers to discover aspects of the product, eg the most economical way of cutting a material or how stresses and loads will perform on it, without costly physical modelling. Ideas can also be shared quickly around the world using the internet.
CAM modelling
The manufacture of a part or product from a computer aided design (CAD) using computer-controlled machinery, such as a 3D printer. can help produce full-size or Having a fixed relationship to the actual dimensions of an object. The relationship is usually stated as a ratio, eg. 25:1. 3D models of a product. A designer can create the design in CAM, or input an existing 2D CAD drawing. The X, Y and Z values that represent a known point in space. are automatically generated and use X, Y and Z values to build a model on a 3D printer, using points on an invisible grid.
X, Y and Z coordinates
As x increases, the point on the axis moves further away from where x and y meet, and when x decreases, the point moves back towards the intersection. As y increases, the point moves further up, away from the x and y meeting point, and when y decreases, the point moves down again.
An x and y coordinate creates a point on a 2D grid that can be used on machines, such as a A machine that uses a laser beam to vaporise material and cut out shapes very accurately., that only cut flat materials. A z coordinate is added to make the point become 3D and can be used to build objects on machines such as a 3D printer.
