

Result: Vale of Glamorgan
| TOP THREE PARTIES AT A GLANCE | ||
|---|---|---|
| Labour | 41.2% | |
| Conservative | 37.3% | |
| Liberal Democrat | 13.0% | |
| Swing: 3.3% from LAB to CON | ||
| IN DETAIL | ||||
|---|---|---|---|---|
| Name | Party | Votes | % | +/- % |
| John Smith | Labour | 19,481 | 41.2 | -4.2 |
| Alun Cairns | Conservative | 17,673 | 37.3 | +2.3 |
| Mark Hooper | Liberal Democrat | 6,140 | 13.0 | +0.8 |
| Barry Shaw | Plaid Cymru | 2,423 | 5.1 | -1.2 |
| Richard Suchorzewski | UK Independence Party | 840 | 1.8 | +0.8 |
| Karl-James Langford | Liberal Party | 605 | 1.3 | +1.3 |
| Paul Mules | Socialist Labour Party | 162 | 0.3 | +0.3 |
| Majority | 1,808 | 3.8 | ||
| Turnout | 47,324 | 68.9 | +2.2 | |
KEY SEAT
| POLITICAL MAKE UP OF WALES | |||
|---|---|---|---|
 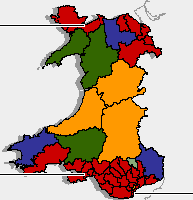  | |||
| 2001 RESULT FOR VALE OF GLAMORGAN | ||
|---|---|---|
| Labour | 45.4% | |
| Conservative | 35.0% | |
| Liberal Democrat | 12.2% | |
| Others | 7.4% | |
