�In detail:�Smart meters
�In detail:�Smart meters |
|
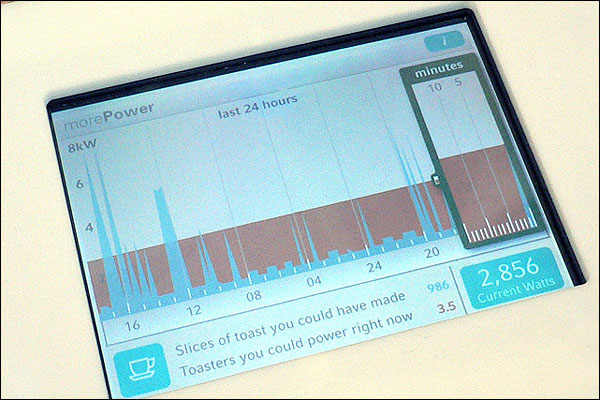
The red bar shows the amount of electricity that is currently being used. The blue graph shows the pattern of electricity consumption over a period of time. (Image: More Associates) |
Click below for more images | ||||||||
| NEXT | |||||||
