More about this graph
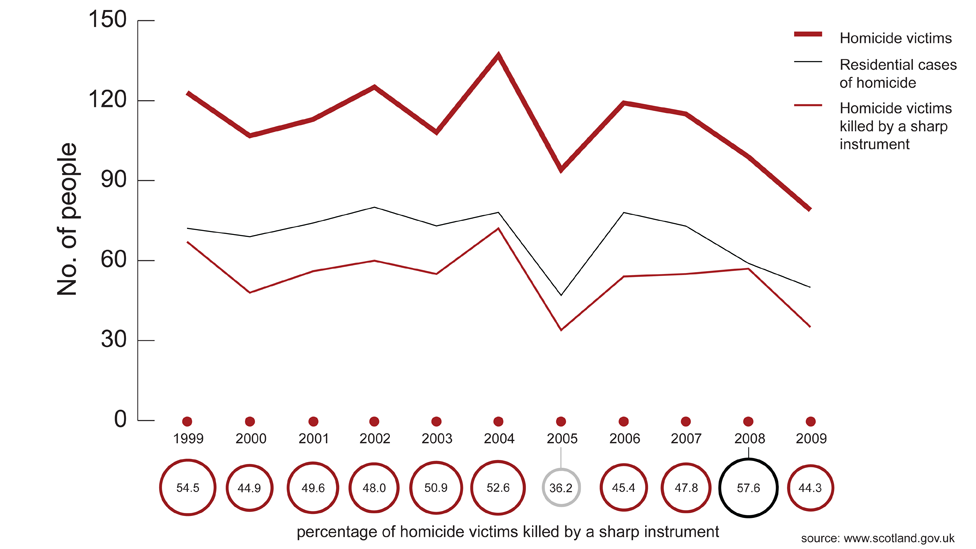
It shows the number of homicide victims in each year, and the number of those victims killed by a “sharp instrument”. This is the statistical expression which mainly includes knives and other bladed weapons, but can also include glass. These graphs are roughly parallel, suggesting the proportion of homicide victims killed by knives has remained fairly constant.
The third line on the graph, again which roughly paralell to the overall number, shows the number of homicide cases is residential settings – houses or flats, common closes or gardens.
It is important to remember the difference between homicide victims and homicide cases. The former is a total of people killed illegally in any year; the latter refers to the year in which the crime was recorded by police. This is not necessarily the same year in which the offence took place.
So a case may not necessarily be recorded in the year the homicide took place – but it usually is. For example, someone might have been murdered in 2006 but we have just found out now so the case is recorded in 2011.
 Analysis: Scotland's knife crime needs 'sophisticated response'
By Reevel Alderson, BBC Scotland's home affairs correspondent