The headlines are unequivocal:"Record numbers of school kids bunking off""Truancy stats soar""Truancy levels on the rise"
A press release from Southampton Liberal Democrats is just as specific: "These figures are disgraceful, with truancy in the city now at a record high. Despite promising to get a grip on this problem, truancy levels have rocketed under Labour."
But when I try to work out a wider picture things appear less black and white.
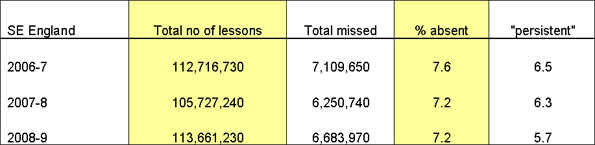
Over the last three years across all local authorities in South East England the proportion of lessons missed has fallen.
On the key government target - the percentage of persistent truants - there's been a steady reduction in the South East each year.
If you can bear it, have a glance at the raw data. It's for state secondary schools, Autumn and Spring terms.
This is the stuff we try to turn into a headline - it's sometimes more like reading tea-leaves:
So who's lying? Who's manipulating the statistics?
There is, I'm afraid, no simple answer, as you can work out for yourself from the table below, where I've listed just some of the local authority data for 2009 and 1997.
One important complicating factor is the crack-down on parents taking children out of school for cheaper holidays. What used to count as an authorised absence is now an unauthorised one.
This explains how some authorities - Dorset, Hampshire, West Sussex - can say they've cut the percentage of lessons skipped over the 12 years even though unauthorised absences are up.
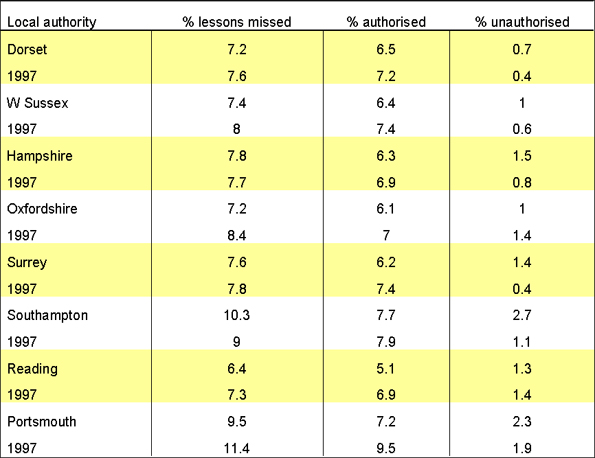
But within the overall improvement there are some terrible hotspots - Southampton is one - with an overall increase in truancy and a shocking 11.9 percent - more than one in ten schoolchildren - now classified as persistent truants according to the national measure.
Even that could be tarring all schools with the same brush - some must be better than others within the authority - and presumably some even worse.
I rather liked this headline from our commercial radio rival: "Truancy figures mixed in Surrey and Hants" but it doesn't really inform, or entertain...
Now I've always tried to pay attention in Maths classes, but I need help!
Please tell me below what you make of these stats.. because I really would like to make sense of it.

 There are 73,683 registered voters in the Gosport parliamentary constituency. And now it seems the conservatives will be consulting all 73,683 people by post to decide who should be their next candidate.


 Welcome to the hustings! I'm Peter Henley, the BBC's political reporter in the south of England. From parish councils in Sussex, to European politics in Oxford, this is the blog for you.