
The science of coalition government economics
So I'm doing a few days as "Cuts Correspondent" (or "Savings Correspondent" depending on your point of view). I'll be back on the Science beat soon. But in the meantime is there anything science can teach us about the abilities of coalition governments when it comes to tackling debt? As we like to say here "science is the answer."
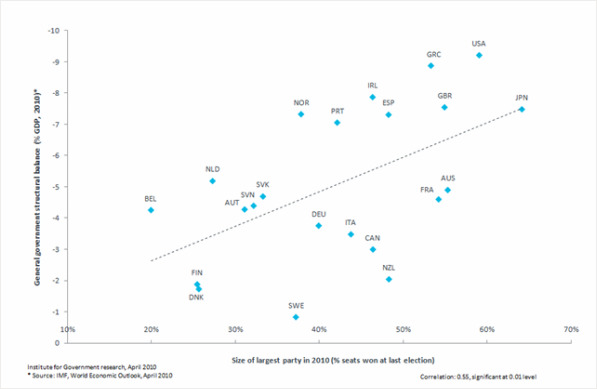 Well perhaps. This graph comes from the Bad Science blog via the Institute for Government Research. Along the x-axis at the bottom is the size of the largest political party and up the y-axis on the side is the size of government debt. It looks like the nice blue line shows that there's a link between the two and that countries with one large political party have the largest debt.
Which of course would seem to indicate that our new coalition government has a good chance of tackling our deficit.
Well I'm indebted to Ben Goldacre who writes the Bad Science blog for bringing this interesting fact to our attention. Although I should also say commentators there give the idea the thumbs down! Read their entertaining discussion here.
Science is always the answer. But with this graph perhaps we're asking the wrong question?
 I'm David Gregory, BBC Science Correspondent for the West Midlands. My first law states: "Science is the answer." There is no second law. Feel free to drop me a line:
Comments
Sign in or register to comment.