Real life situations such as travelling over time and across distance can be drawn on a graph.
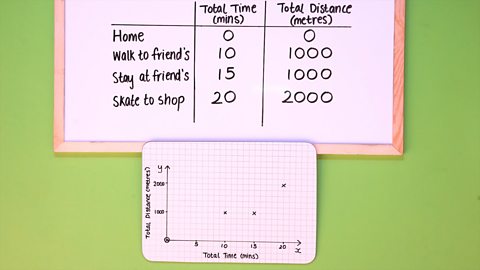
Exact distances and times are plotted on the graph. These are shown as co-ordinates.
These points are then connected with straight lines to assist with further questions.
Find out how to draw a graph from real life examples
How to plot your graph
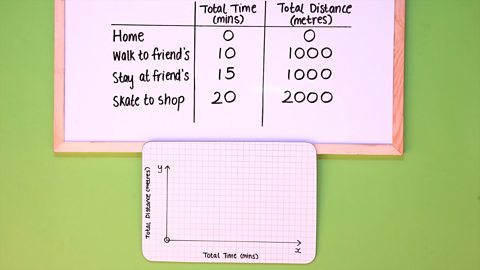
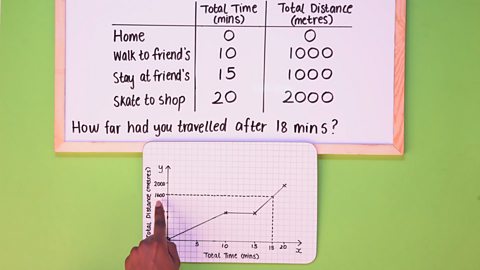
A distance/time graph shows time on one axis (x) and distance on the other axis (y).
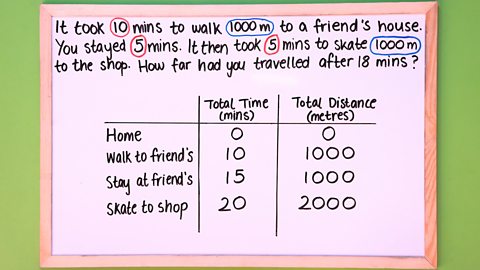
It is important to plot the important information from the problem.
For example:
(0,0) is the starting point because no time has passed and no distance has been travelled.
(10,1000) shows that after 10 minutes has passed a distance of 1000 m has been travelled.
Have a go
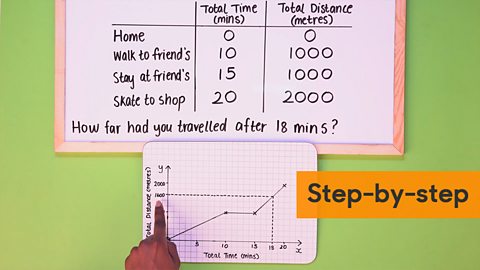
Image caption, Click to see a step-by-step slideshow.

1 of 6
End of image gallery
More on Straight line graphs
Find out more by working through a topic
- count5 of 8
- count6 of 8

- count7 of 8

- count8 of 8