A coordinate is shown using two values, separated by a comma with brackets around them.
The values show the position on the x axis (horizontal line) and y axis (vertical line).
A coordinate represents the exact position of a point.
Find out how to plot coordinates
Have a go
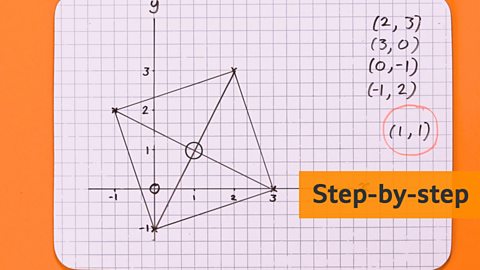
Image caption, Click to see a step-by-step slideshow.


1 of 10
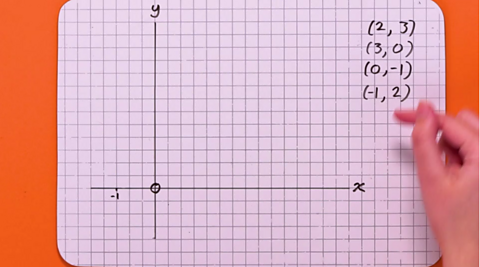
The basics
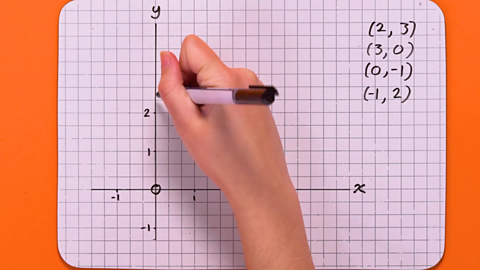
Coordinates are plotted on a pair of axes and show the exact position of a point.
Each axis is labelled with a scale of numbers, like a number line.
The values can be positive or negative.
(0,0) is the point where both axes cross. It is called the origin. The position of a coordinate is shown using an X.
There are two axes:
The x axis is left to right (horizontal)
The y axis is bottom to top (vertical)
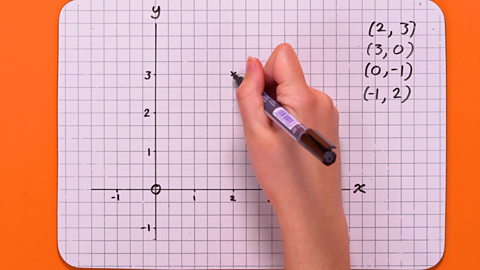
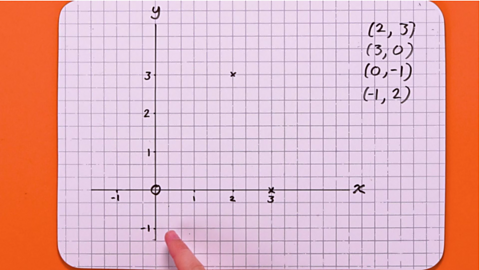
Let's get plotting
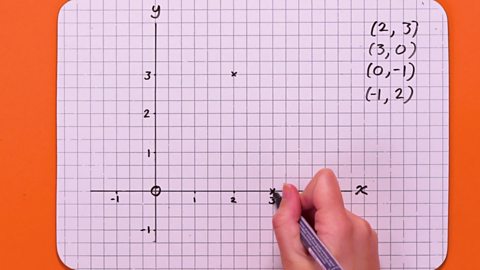
Plot the coordinate (2,3)
The first number in the brackets relates to the x axis.
The 2 means move two places to the right, along the x axis.
The second number in the brackets relates to the y axis.
The 3 means move three places up, along the y axis.
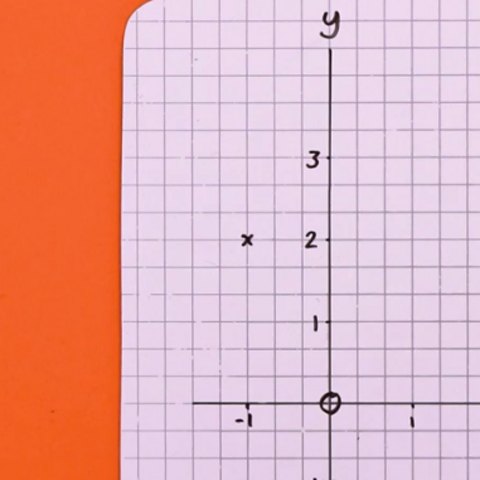
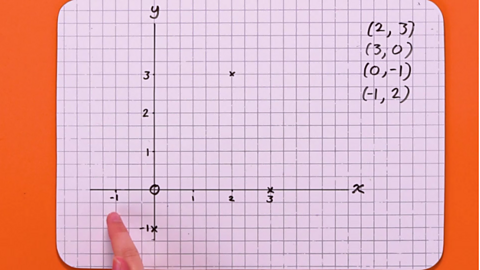
Plot the coordinate (-1,2)
Remember the first number in the brackets relates to the x axis.
The -1 means move one place, but because there is a minus sign in front of it, this time we move one place to the left, along the x axis.
The second number in the brackets relates to the y axis.
The 2 means move two places up, along the y axis.
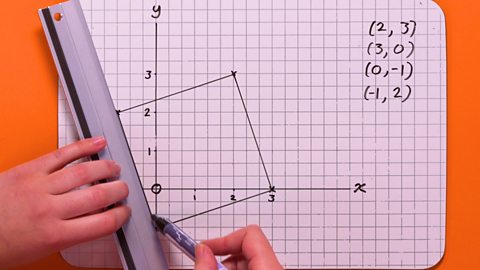
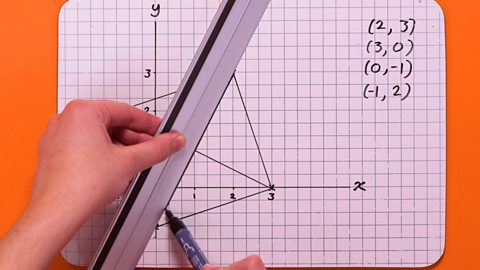
Plotting multiple coordinates
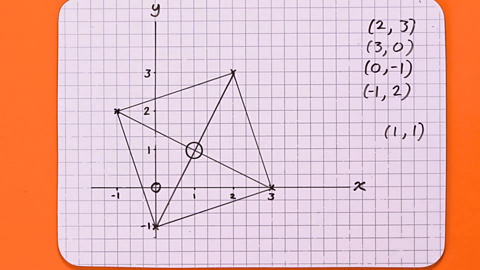
A list of four coordinates can be used to represent the corners of a shape.
For example, (2,3), (3,0), (0,-1) and (-1,2) when plotted and joined together, make a square.
Coordinates can also be used to show the position of objects or places on a map.
Coordinates quiz
Test your knowledge with this quick quiz.
More on Coordinates
Find out more by working through a topic
- count1 of 2