What is a pictogram?
A pictogram uses pictures or symbols to represent data or information.
Each picture represents a number of items, making the data clear and easy to read.
The title of the pictogram tells us what the information is about.
The pictures and labels show us what each symbol represents and how much it stands for.
Activity: How to use pictograms
Complete this interactive activity to understand how to read information in a pictogram. Then put your knowledge to the test.
Pictograms
Pictograms are data tables which use pictures to represent numbers and data.
The information in a pictogram is organised in rows and columns.
Rows go across and columns go down.
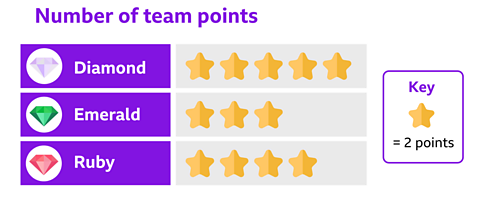
All pictograms should have a key. The key will tell you what each picture stands for.
One picture might equal more than one item.
You can count how many pictures are in each row or column.
Then, if each picture represents more than one item, you can work out the number of items by multipling.
For example, if one picture equals 5 items and there are 3 pictures, you can multiply using your times tables.
5 x 3 = 15
The 3 pictures represent 15 items in total.
Remember, to read pictograms carefully so you understand what the pictures mean.
Example 1
Take a look at this pictogram.
A Year 2 class went on a school trip to the zoo. After they had visited, they created a pictogram of their favourite animals.
The title of this pictogram is 'Favourite animal at the zoo'.
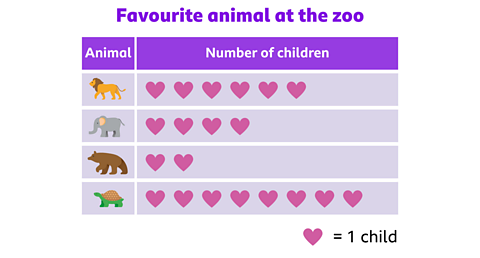
How many children voted in total?
✓ To work out how many children voted, you have to add together all of the hearts in the pictogram.
Each heart represents one student.
There are 20 hearts in total.
So 20 children voted.
Example 2
Now, let's look at another pictogram.
The title of this pictogram is 'Number of children at football practice'.
The footballs show how many children came to football practice over 5 weeks.
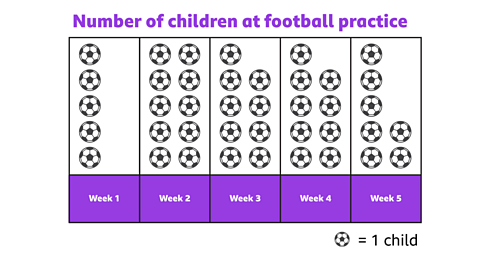
How many more children came to practice in week 2 than week 1?
✓ There are 5 footballs above Week 1.
So 5 children came to practice in Week 1.
There are 10 footballs above Week 2.
So 10 children came to practice in Week 2.
Therefore, 5 more children came to football practice in Week 2 than in Week 1.
Example 3
This pictogram looks at the most popular fruit in the school canteen.
Each picture of fruit represents 5 pieces of fruit eaten at lunchtime.
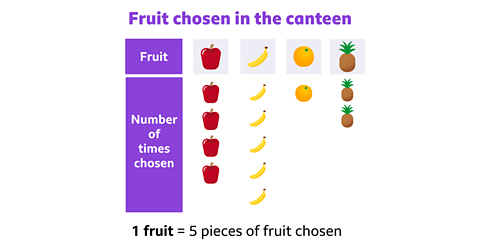
How many apples were eaten?
✓ There are 4 apples in the pictogram.
So, 4 lots of 5 apples were eaten.
4 × 5 = 20
So 20 apples were eaten at lunchtime.
Karate Cats Maths game. game
Train with the Karate Cats to become an expert in addition and subtraction, multiplication and division, place value and more!

More on Tables, graphs and charts
Find out more by working through a topic
- count2 of 7

- count3 of 7

- count4 of 7

- count5 of 7