Simultaneous equations are often two linear equations that can be plotted on a set of axes.
Each linear equation can be drawn as a line on a graph.
The co-ordinate where the two lines intersect will give the solution of x and y.
How do you solve simultaneous equations using graphs?
How to solve simultaneous equations using graphs.
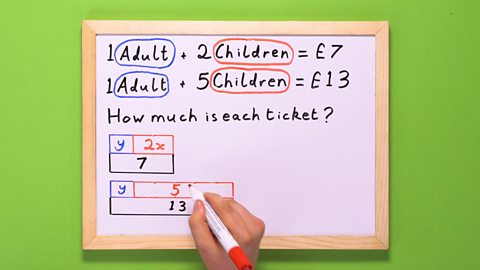
How much is each ticket?
Draw a bar to represent one adult and two children’s tickets.
Let’s call the adult ticket 𝑦 and the child ticket 𝑥.
Another bar represents the total of £7.
Do the same for the second set of tickets.
And simplify the diagram by writing 2𝑥.
And on the other, 5𝑥.
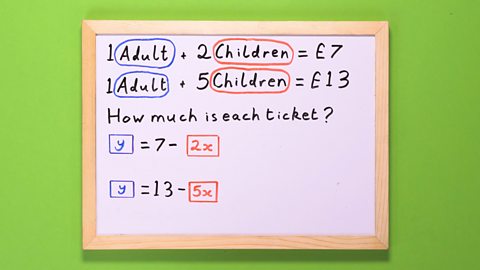
You can see that 𝑦 + 2 = 7.
Which means 𝑦 = 7 – 2𝑥.
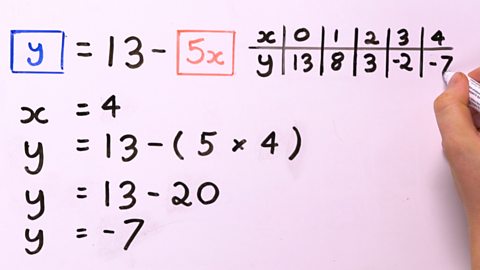
You can also rewrite the second equation, 𝑦 = 13 – 5𝑥.
Now, draw their graphs.
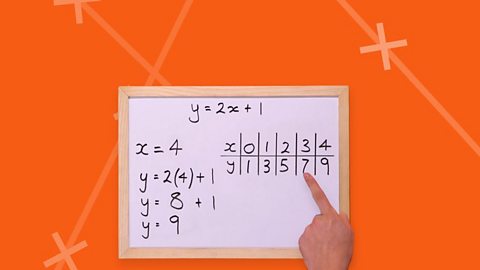
First, draw a table of values.
Start with 𝑥 = 0 and substitute this into our equation.
When 𝑥 = 0, 𝑦 = 7.
Next, substitute 𝑥 = 1.
𝑦 = 5.
Substitute up until 𝑥 = 4.
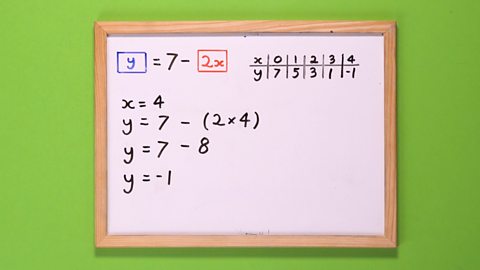
We need to do the same again for the equation, 𝑦 = 13 – 5𝑥, with a new table of values and substitute 𝑥 = 0.
𝑥 = 1.
𝑥 = 2.
𝑥 = 3.
And, finally, 𝑥 = 4.
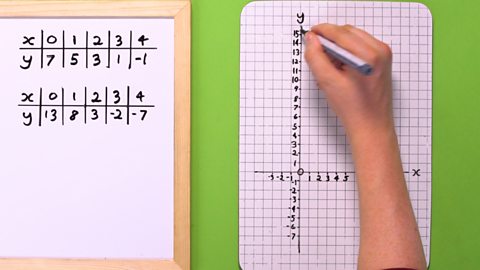
You now have five pairs of co-ordinates for both line graphs and you need to plot them both on the same axes.
Draw the 𝑥 and 𝑦 axes. Make sure the 𝑥-axis includes the values 0 to 4, and the 𝑦-axis the values –7 to 13.
Plot the co-ordinates on the axes. Remember, the 𝑥 co-ordinate is always first.
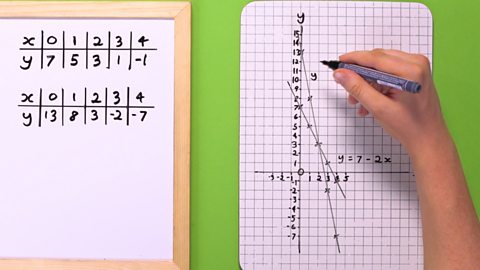
We’ve plotted the points from the first table. Join these points with a straight line.
𝑦 = 7 – 2𝑥.
Now, plot the co-ordinates from our second table. Join these points with a straight line.
𝑦 = 13 – 5𝑥.
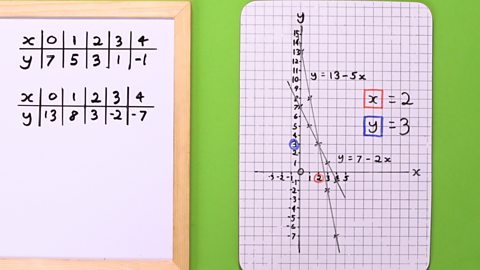
Both lines cross each other at one co-ordinate: when 𝑥 = 2 and when 𝑦 = 3.
This means our 𝑥 value is 2 and our 𝑦 value is 3.
So, the adult ticket, 𝑦, is £3.
And the child ticket, 𝑥, is £2.
Simultaneous equations

Image caption, Click here to see a step by step slideshow.

1 of 9
More on Algebra
Find out more by working through a topic
- count16 of 29

- count17 of 29

- count18 of 29
- count19 of 29