

Result: Swansea East
| TOP THREE PARTIES AT A GLANCE | ||
|---|---|---|
| Labour | 56.6% | |
| Liberal Democrat | 20.1% | |
| Conservative | 10.1% | |
| Swing: 9.3% from LAB to LD | ||
| IN DETAIL | ||||
|---|---|---|---|---|
| Name | Party | Votes | % | +/- % |
| Sian James | Labour | 17,457 | 56.6 | -8.6 |
| Robert Speht | Liberal Democrat | 6,208 | 20.1 | +9.9 |
| Ellie Bland | Conservative | 3,103 | 10.1 | 0.0 |
| Carolyn Shan Couch | Plaid Cymru | 2,129 | 6.9 | -4.6 |
| Kevin Holloway | British National Party | 770 | 2.5 | +2.5 |
| Tim Jenkins | UK Independence Party | 674 | 2.2 | +0.7 |
| Tony Young | Green | 493 | 1.6 | +0.1 |
| Majority | 11,249 | 36.5 | ||
| Turnout | 30,834 | 52.4 | +0.1 | |
| POLITICAL MAKE UP OF WALES | |||
|---|---|---|---|
 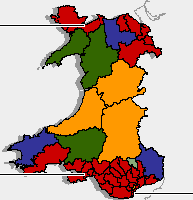  | |||
| 2001 RESULT FOR SWANSEA EAST | ||
|---|---|---|
| Labour | 65.2% | |
| Plaid Cymru | 11.5% | |
| Liberal Democrat | 10.2% | |
| Others | 13.1% | |
