

Result: Caernarfon
| TOP THREE PARTIES AT A GLANCE | ||
|---|---|---|
| Plaid Cymru | 45.5% | |
| Labour | 26.9% | |
| Liberal Democrat | 12.5% | |
| Swing: 3.3% from LAB to PC | ||
| IN DETAIL | ||||
|---|---|---|---|---|
| Name | Party | Votes | % | +/- % |
| Hywel Williams | Plaid Cymru | 12,747 | 45.5 | +1.1 |
| Martin Eaglestone | Labour | 7,538 | 26.9 | -5.4 |
| Mel Ab Owain | Liberal Democrat | 3,508 | 12.5 | +6.2 |
| Guy Opperman | Conservative | 3,483 | 12.4 | -2.8 |
| Elwyn Williams | UK Independence Party | 723 | 2.6 | +0.7 |
| Majority | 5,209 | 18.6 | ||
| Turnout | 27,999 | 60.4 | -1.6 | |
KEY SEAT
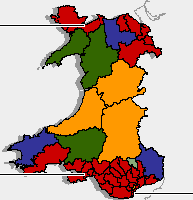
| POLITICAL MAKE UP OF WALES | |||
|---|---|---|---|
   | |||
| 2001 RESULT FOR CAERNARFON | ||
|---|---|---|
| Plaid Cymru | 44.4% | |
| Labour | 32.3% | |
| Conservative | 15.2% | |
| Others | 8.1% | |
